
 Cameroon ·
The dependency ratio holds a special place in the family of demographic indicators. It claims neither to summarise an economy nor to measure a standard of living, and it stands in for none of the instruments available to planners. It does something narrower and more committal: it sets dates. By relating the people too young or too old to work to every hundred people of an age to do so, and by fixing a convention at sixty, it makes it possible to announce the year from which the structure of a population becomes favourable to collective enrichment. It is the source of the expression “window of the demographic dividend”, and it is by this ratio that one establishes whether the window is open, closed or about to open. An indicator that gives dates naturally finds its place in planning documents, and this one is there.
Applied to the nine countries of Central Africa, it produces a clear ranking. Gabon comes first, with 68.0 dependants per hundred people of working age in 2024. The Central African Republic comes last, with 104.5. The reading seems transparent: Gabon has made its demographic transition, the Central African Republic has not begun it, and we would therefore know which of the two is nearing the favourable moment.
Crossing the same population data with the employment rates published by the International Labour Organization yields a second ratio, which asks the same question while changing one definition: how many people, in practice, live off each person who works. This ratio ranks Gabon last, at 283.3, and places the Central African Republic third, at 184.4. Across the region, it shows that each person who works supports 2.94 people, themselves included. The two measures show no statistically detectable correlation.
The gap is not a quirk of calculation. It is systematic, it always runs in the same direction, and it stems from an assumption buried in the construction of the older of the two indicators. That is the subject of this report: what a figure assumes when it appears to assume nothing, and what it costs to forget it.
What a dependency ratio counts
The dependency ratio belongs to that category of instruments so old and so universally used that we have stopped questioning their definition. Yet it rests on a convention heavy with consequences, since it equates age with activity. Anyone between fifteen and sixty-four is counted as productive, anyone outside those bounds as dependent. Nothing in the formula takes any interest in what these people do with their days.
This convention is not absurd; it is historically situated. It took its modern form in the industrial economies of the mid-twentieth century, where working age and actual employment coincided closely, where wage employment covered most of the working-age population, and where inactivity was the statistical exception rather than the rule. Counting fifteen-to-sixty-four-year-olds then amounted, roughly, to counting workers, and the approximation cost little.
The theory that gives this ratio its predictive value dates from the same period. It holds that falling fertility, by reducing the number of dependent children, frees up savings, allows more investment per head and so produces an acceleration in income per capita. This is the mechanism of the demographic dividend, of which David Bloom and Jeffrey Williamson provided, in 1998, the most widely cited empirical demonstration, drawing on the East Asian case, in an article whose working-paper version remains freely available. They attribute a substantial share of East Asia’s take-off between 1965 and 1990 to the change in age structure alone, while specifying, in a sentence that those who cite them almost always leave out, that the effect was in no way inevitable and occurred because these countries had the institutions and policies needed to convert potential into results.
The chain of reasoning therefore presupposes a sequence. The economy is transformed, fertility falls as a result, the age structure improves, and the productive system absorbs the labour thus released. The dependency ratio measures only the third link in this chain, and it is worth anything as a signal of future prosperity only if the others hold.
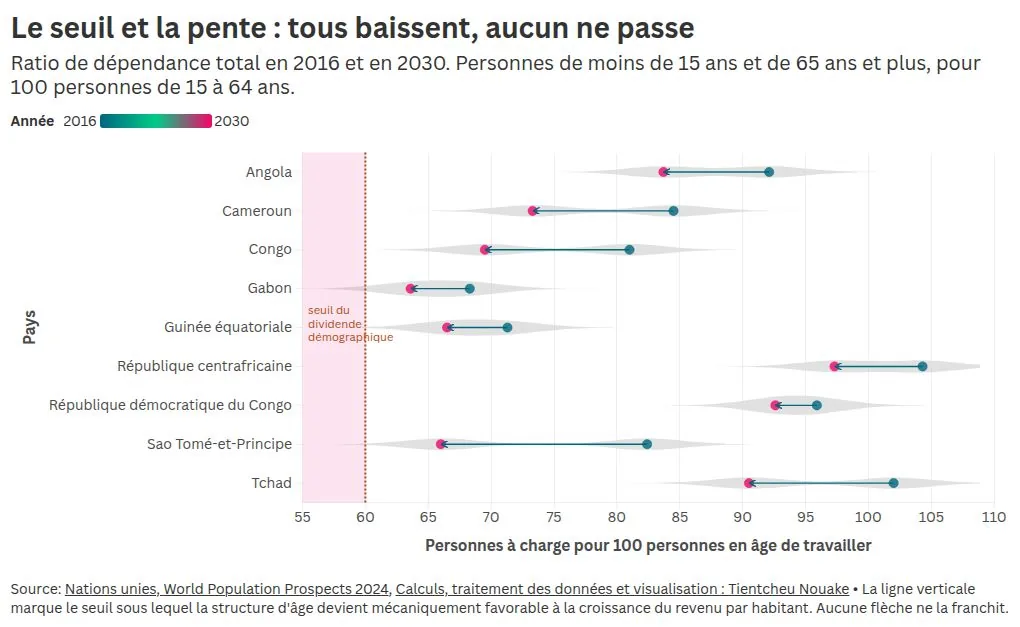
Read through this indicator, Central Africa tells its story with ease. The ratio falls in all nine countries, by six points on the regional average between 2016 and 2030, and none crosses the threshold of sixty by that date: Gabon stops at 63.6, the Central African Republic at 97.3, the regional average at 86.8. The usual conclusion follows effortlessly: that the region is nearing its window without yet having opened it, that it should therefore accelerate its fertility transition, and that it would find its models among the best-ranked countries.
Counting the same thing differently
The dependency ratio has a little-used cousin, which the literature calls the economic dependency ratio. It asks the same question, replacing age with activity, and its formula is as simple as that of its elder: the total population minus the people in employment, divided by the people in employment.
The calculation requires two series. Population by age group comes from the United Nations’ World Population Prospects, 2024 revision. The employment rate, that is, the share of people aged fifteen and over engaged in paid work, comes from the International Labour Organization’s modelled estimates, republished by the World Bank under the indicator SL.EMP.TOTL.SP.ZS. Eight of the nine countries have a value for 2024; São Tomé and Príncipe has none and drops out of the calculation, which is of no consequence since it accounts for one thousandth of the regional population. The result is as follows.
| Country | Employment rate 15+ | Age dependency | Economic dependency | People per job |
|---|---|---|---|---|
| Gabon | 41.0% | 68.0 | 283.3 | 3.8 |
| Equatorial Guinea | 55.9% | 69.3 | 185.1 | 2.9 |
| Congo | 54.3% | 76.2 | 207.8 | 3.1 |
| Cameroon | 63.2% | 78.9 | 169.6 | 2.7 |
| Angola | 64.4% | 89.1 | 178.5 | 2.8 |
| Chad | 59.0% | 92.4 | 213.6 | 3.1 |
| DR Congo | 61.6% | 96.4 | 200.8 | 3.0 |
| Central African Rep. | 68.8% | 104.5 | 184.4 | 2.8 |
Population: United Nations, World Population Prospects 2024, 2024 values. Employment rate: ILO modelled estimates republished by the World Bank, 2024. Ratios calculated by the author.
Three things stand out, in ascending order of importance. The first is the size of the gap. Where the conventional indicator reports between 68 and 105 dependants per hundred people of working age, the employment-based measure reports between 170 and 283. The difference between the two ranges from 80 points in the Central African Republic to 215 in Gabon. Taken across the eight countries, it means that each person who works supports 2.94 people in all. This is not a nuance; it is a doubling of the burden.
The second is the disappearance of the ranking. Gabon, first on the conventional indicator, becomes last. The Central African Republic, last, rises to third. The correlation coefficient between the two measures stands at −0.40, with a p-value of 0.33, which means that no statistically detectable relationship links them in this sample. Two indicators that share a name, measure the same idea and produce orderings unrelated to each other.
The third is the most interesting, because it points to a mechanism rather than a gap. The age dependency ratio and the employment rate are positively correlated, with a Pearson coefficient of 0.776 and a p-value of 0.024, confirmed by a Spearman’s rho of 0.786. The further a Central African country has advanced in its demographic transition, the fewer people it employs. The relationship is strong, it remains significant despite the small sample, and it is exactly the opposite of what the theory of the dividend leads one to expect.
Why the gap is systematic
A correlation of this sign across eight observations could be down to chance. Two well-identified mechanisms produce it, and they operate at the two ends of the ranking.
At one end are economies in which the overwhelming majority of adults work for lack of an alternative. In subsistence farming, in small-scale urban trade, in survival activities, inactivity is not an option on offer, because nobody pays for it. The employment rate there is therefore mechanically high, and all the more so where social protection is absent. The Central African Republic thus posts the highest employment rate in the region, at 68.8%, which says strictly nothing about the quality, income or security of these occupations. By the same token, fertility there remains high, for want of the transformations that bring it down elsewhere, and the age dependency ratio is the least favourable of the nine.
At the other end are economies whose wealth comes from a sector that employs almost no one. Oil extraction produces considerable value added with negligible labour intensity, distributed through public spending rather than through wages. The population urbanises, girls go to school, the age at marriage rises, fertility falls and the age structure improves, without any productive transformation having taken place. Gabon offers the clearest case, with an employment rate of 41.0%, twenty-eight points below the Central African Republic, in the richest country per head of the nine.
The theoretical consequence deserves to be stated plainly. In the classic sequence, fertility falls because the economy is transformed, and the resulting age structure is converted into growth because the productive system absorbs the additional labour. In Central Africa, fertility is falling where the economy has not been transformed, and through mechanisms that create no jobs: rents, urbanisation, the schooling of girls. The demographic transition there is taking place cut off from the engine that, historically, made it pay.
This decoupling does not invalidate the fall in fertility, which remains progress in its own right and a defensible goal for many reasons other than the dividend. It invalidates the mechanical promise attached to it. A favourable age structure in an economy that does not employ is a favourable age structure, nothing more.
The emergence plans put to the test of the same decade
The region’s recent policy history offers a way to check this reading, because it has produced something close to a natural experiment: between 2007 and 2017, almost all these states adopted a development plan built on the same diagnosis, with the same vocabulary and dated horizons.
Equatorial Guinea launched its Vision 2020, Gabon its Emerging Gabon Strategic Plan with a 2025 horizon, Cameroon its Vision 2035, the Republic of the Congo its National Development Plan, Chad its Vision 2030. A study by the Group for Research and Information on Peace and Security noted as early as 2014 that these documents, largely inspired by the trajectory of the Asian emerging economies, all aimed at the same transformation: moving beyond the export of raw commodities, industrialising, creating jobs. The deadlines have now been reached or are close. Equatorial Guinea’s is behind us; Gabon’s has just passed.
The 2024 employment rates allow a partial assessment, and the result is almost exactly the reverse of the stated ambition. The three countries whose plans promised the fastest diversification, because they started from the heaviest dependence on oil, are those that today employ the smallest share of their population: Gabon at 41.0%, the Republic of the Congo at 54.3%, Equatorial Guinea at 55.9%. The two countries that had neither the same rents nor the same initial capital, Cameroon and Chad, post 63.2% and 59.0%.
This divergence reappears in the most recent macroeconomic projections. Data from the Monetary Policy Committee of the Bank of Central African States (BEAC) published in April 2026, reported by the regional financial press, describe a two-speed CEMAC in which the capacity to diversify becomes the main source of resilience: Cameroon and Chad emerge as the sub-region’s engines of growth to 2030, while Gabon and Equatorial Guinea suffer the lasting effects of oil decline.
The value of this comparison is that it neutralises the explanation based on political will. These plans were written in the same decade, with the same consultancies, often in the same terms, and nothing suggests that the worst-performing governments were the least sincere. What separates them is the structure to which they were applied. A concentrated rent, distributed through the budget, produces an administrative elite, an urban middle class dependent on public procurement, and very few firms exposed to competition. It makes announcing diversification easy and carrying it out improbable, because it deprives the country of the actors who would be its beneficiaries and therefore its defenders.
Gabon, moreover, had already been through this sequence. After the oil shock of 1973, rents there financed an infrastructure policy on a grand scale, followed by a decade of prosperity, then a slump to growth of around two per cent, described at the time as insufficient to generate jobs and reduce poverty. The 2011 plan repeated this diagnosis thirty-five years later, in similar terms. This is not a criticism of the plan, whose analysis was sound, but an observation about what a plan can and cannot do when it must undo the structure that financed it. The mechanism of rents and their crowding-out effects on the rest of the economy is, incidentally, a subject I have discussed elsewhere in connection with Cameroonian gold and the short memory of rentier states.
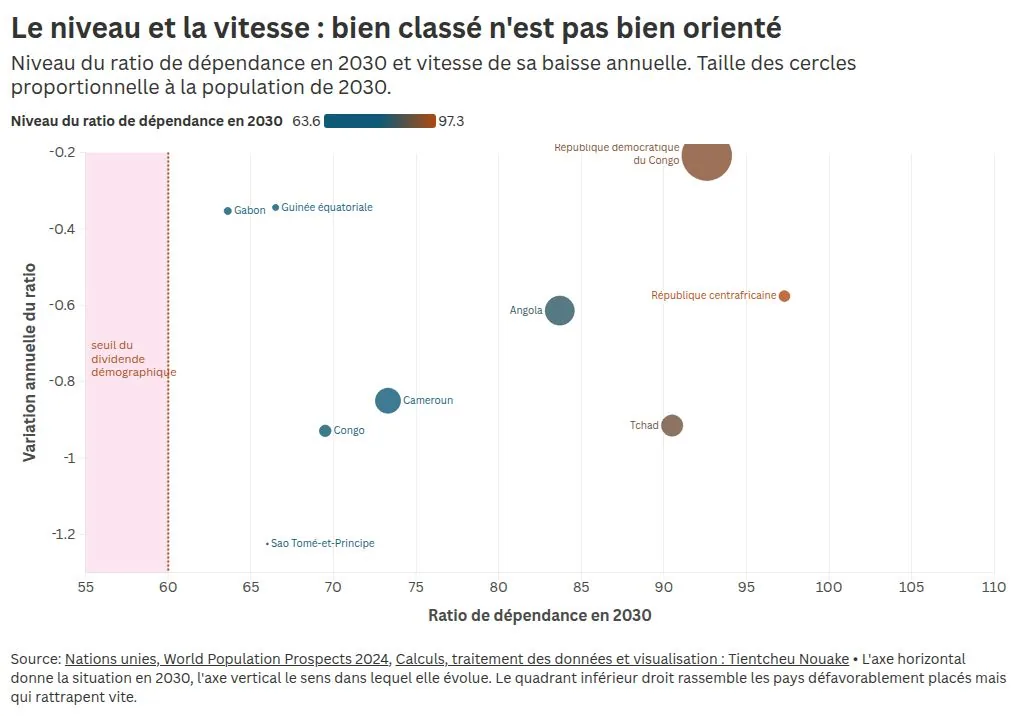
The chart above adds a piece to this argument. Plotting the level of the dependency ratio against the speed of its decline shows that the two best-placed countries are among the slowest to improve: Gabon, first by level, is only seventh by speed, at 0.35 points a year, and Equatorial Guinea, third by level, is eighth by speed. Chad, seventh by level, is third by speed, at 0.91 points a year. The rentier economies are not only those that employ the least; they are also those whose demographic transition is now slowing, having already used up the share of fertility decline that urbanisation could deliver.
What the word “employment” covers here
A correction of measurement invites its own critique, and it would be ill-advised to replace a misleading indicator with one we believed to be exact.
The employment rate used above counts as employed anyone who has done paid work during a reference period, whatever its duration, income or status. It distinguishes neither the protected wage earner from the street vendor, nor the civil servant from the subsistence farmer. Yet the International Labour Organization estimates that the informal employment rate reaches 87.6% in sub-Saharan Africa, and that the region had 145 million working poor, nearly a third of its labour force.
To say that one person supports 2.94 people is therefore, in nine cases out of ten, to describe an activity without a contract, without social contributions and without a guaranteed income. The burden measured by my second ratio is borne not by jobs in the sense that European statistics give the word, but by occupations many of which yield no surplus beyond the subsistence of the person doing them.
I draw from this a conclusion uncomfortable for the very thesis of this report: the second ratio, superior though it is to the first, remains a crude approximation. A faithful measure of the burden would require data on labour income per person employed, which few of these countries produce regularly. What the second ratio contributes is therefore not precision, but the order of magnitude and, above all, the ranking. It does not say how heavy the burden is; it says that the burden does not fall where we think.
The two indicators, moreover, err in opposite directions, which makes them complements rather than substitutes. The age ratio overstates the productive capacity of rent-rich countries, where many people of working age do not work. The economic ratio overstates that of poor countries, where many people work without producing a surplus. Between the two lies the question that matters, which is neither age nor occupation but productivity, and on which the regional data are weakest.
The timetable, which for its part is beyond dispute
These concerns about measurement apply to a quantity that is itself firmly established.
The working-age population of the nine countries rises from 109.4 million people in 2023 to 137.8 million in 2030 according to the United Nations’ medium-variant projections, an extra 28.4 million people in seven years, slightly more than four million a year. This number has a remarkable property: it is already entirely determined. Everyone who will be between fifteen and sixty-four in 2030 was born in 2015 or earlier. A fertility policy launched today would act on births occurring from 2027 onwards, the first of whom would reach working age around 2042.
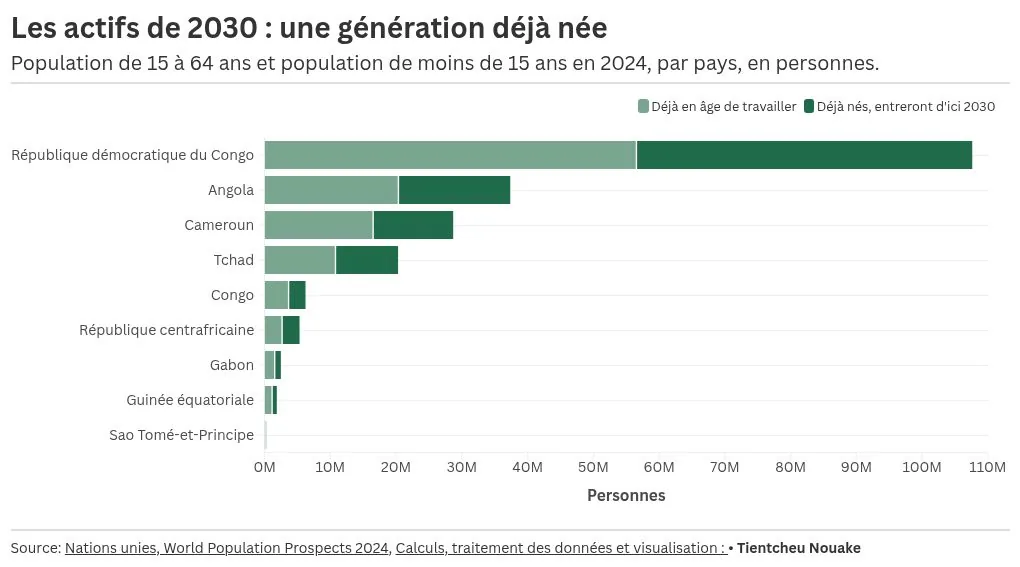
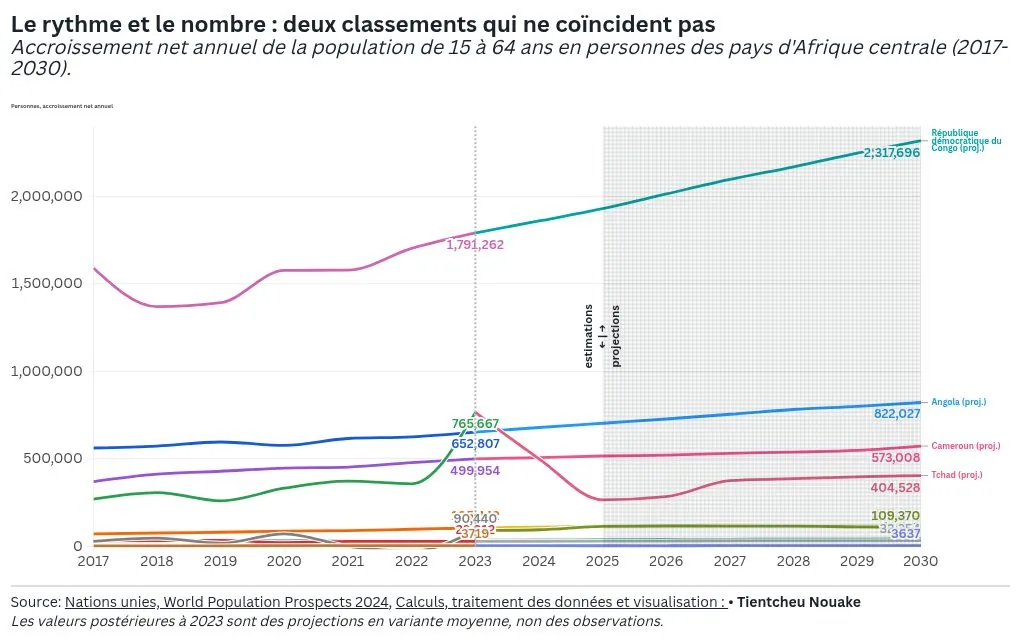
This inertia has a name in demography, momentum, formalised by Nathan Keyfitz in the early 1970s. A population with a young structure goes on growing for several decades even if fertility drops abruptly to mere replacement level, because the number of women of childbearing age continues, mechanically, to rise. Growth is driven by the shape of the pyramid rather than by the behaviour of couples.
The implication unsettles public debate as much as it ought to simplify it. The question of whether or not Central Africa’s population growth should be slowed, whatever answer one gives to it, concerns a horizon that begins in 2045. For the next twenty years, the number is a given, not a variable. What remains open is what these people will find when they arrive, and that is precisely what the age dependency ratio does not measure.
One caveat must be attached to this claim, and it comes from the data themselves. The region’s annual increase goes from 5.97 million people in 2022 to 6.86 million in 2023, a jump of 886,000 in a single year, 478,000 of it in Chad alone, whose growth rate rises from 3.44% to 5.88%. No country doubles its birth rate in twelve months. Chad took in the refugees from Darfur: since the outbreak of war in Sudan in April 2023, more than 844,000 Sudanese have crossed its border, according to UNHCR, on top of the roughly 409,000 received in earlier waves. The momentum argument holds for fertility, not for migration: the number is closed to births but remains open at the borders, in a region whose immediate neighbours produce population shocks of this magnitude.
What absorption costs, once recalculated
The same cross-referencing of data makes it possible to reframe the employment question more usefully than the usual count does.
Relating future entrants to the jobs that exist today gives a measure of effort. For the eight countries with an employment rate, the increase in the working-age population between 2024 and 2030 represents between 27.7% and 36.1% of the existing stock of jobs. The spread is narrow, which was not a foregone conclusion: in absolute volume the burden is extraordinarily unequal, since the Democratic Republic of the Congo alone accounts for 51.6% of the regional increase, but relative to each country’s job base it becomes almost uniform. Gabon, whose volume to absorb ranks only seventh of the nine, shows the highest relative effort in the region, at 36.1%, precisely because its job base is narrow.
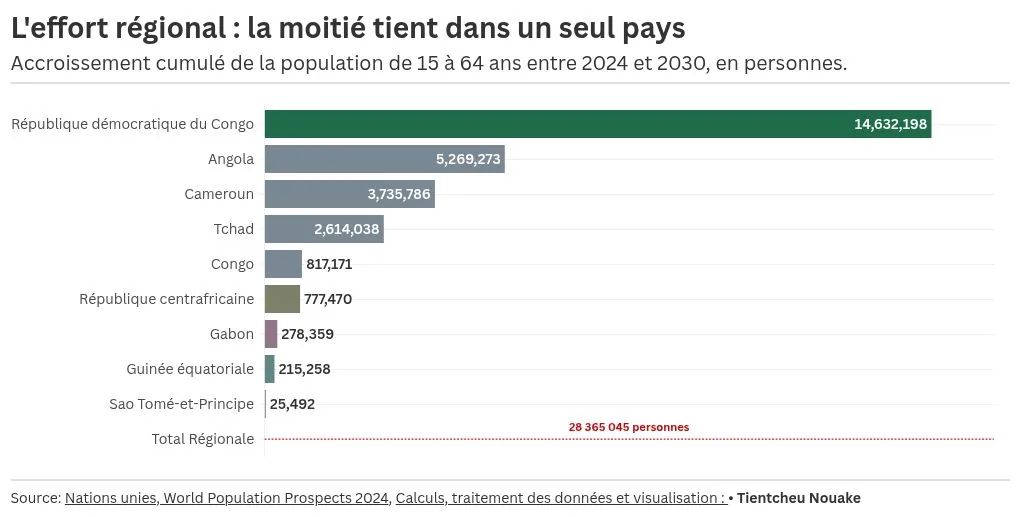
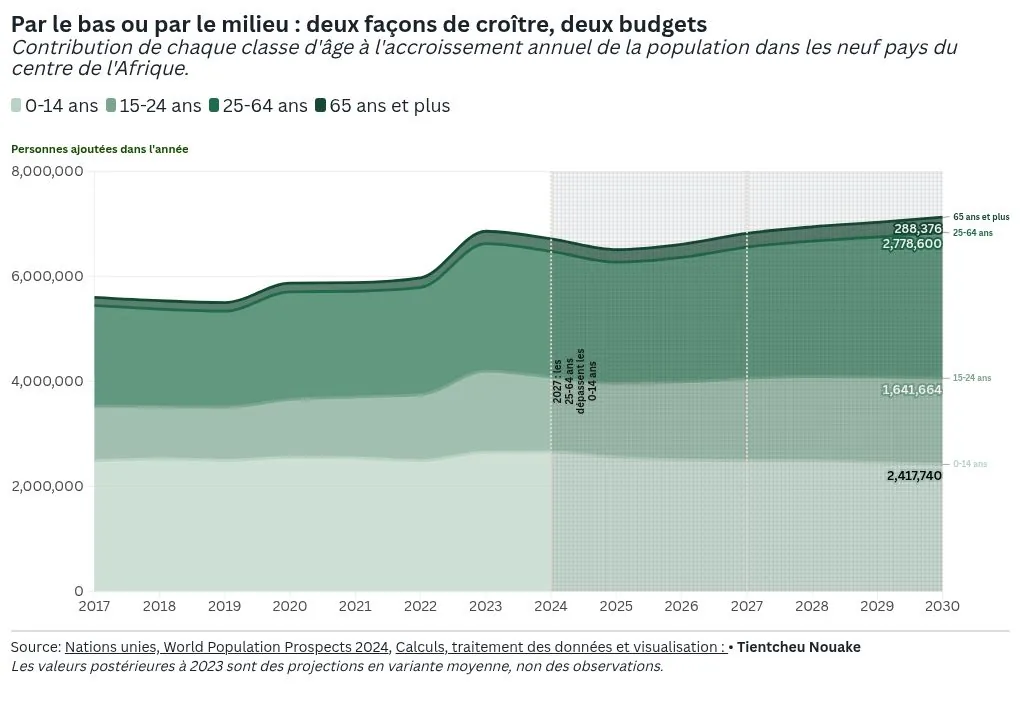
Applying each country’s employment rate to this increase gives the number of jobs needed merely to maintain the current situation, without any improvement: about 2.7 million a year for the eight countries, including 1.4 million for the Democratic Republic of the Congo, 528,000 for Angola, 360,000 for Cameroon and 219,000 for Chad.
A complementary calculation sheds still more light on what these numbers mean. If the aim is no longer to maintain the employment rate but to maintain the burden, that is, to ensure that the number of people living off each job does not worsen by 2030, it would be enough for employment rates to fall by no more than 0.7 points in Chad and 2.5 points in the Central African Republic, the age structure improving enough to offset a slight erosion. Regional economic dependency would then move from 193.5 to 186.4 at constant employment rates.
That is the order of magnitude of the real demographic dividend in this region, once the measure is corrected: seven points of burden in six years, when the burden stands at one hundred and ninety-three. That is not nothing, and it is a very long way from the tipping point that the vocabulary of the window invites one to imagine.
What regional divergence adds to the problem
One last element complicates the picture, and it concerns the level at which these policies are conceived.
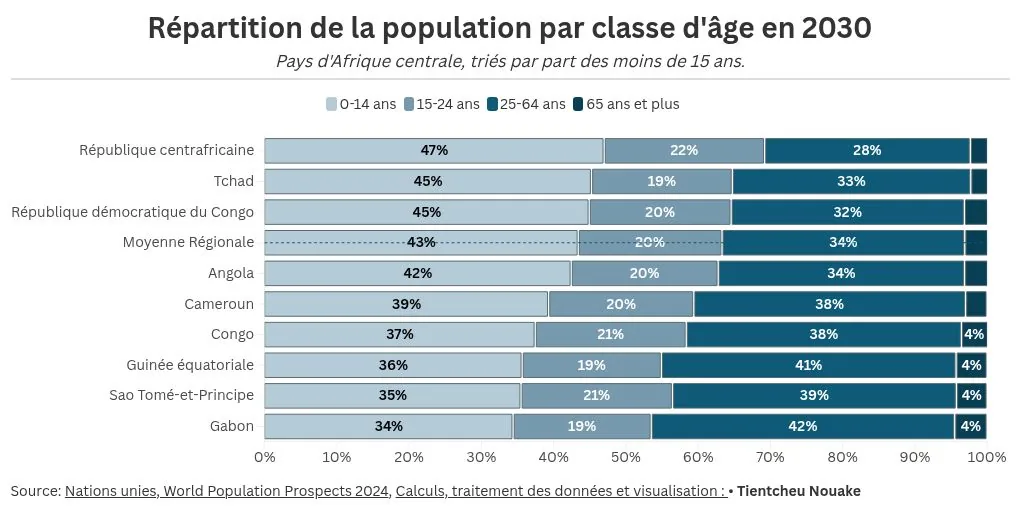
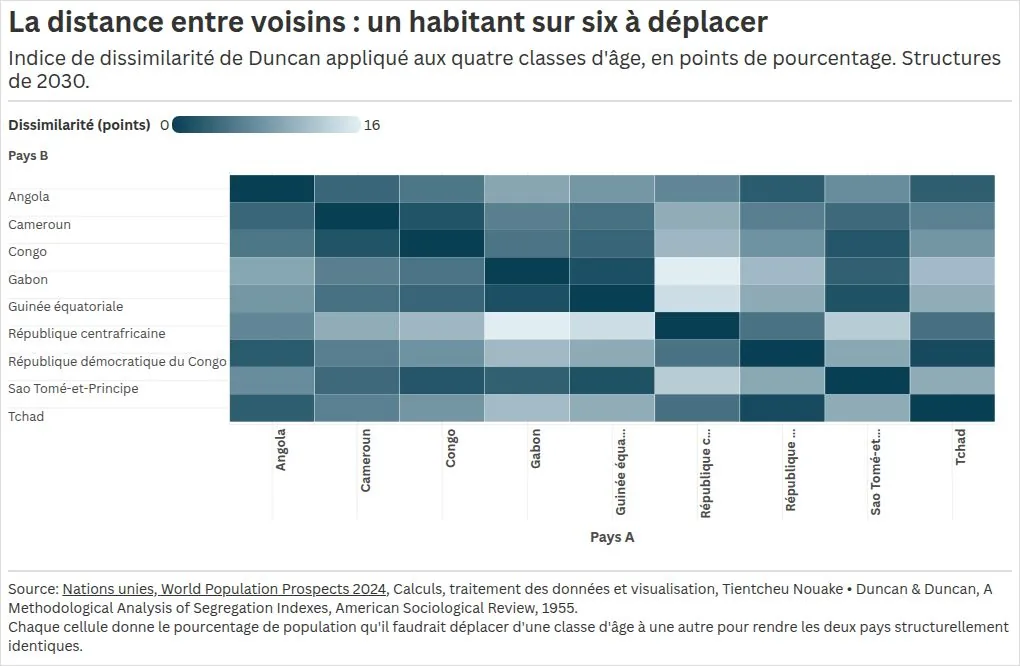
The age structures of the nine countries differ to the point that it becomes difficult to treat them together. In 2030, under-fifteens will make up 47.0% of the population of the Central African Republic and 34.4% of the population of Gabon. Applied to these distributions, the index of dissimilarity that Otis Dudley Duncan and Beverly Duncan proposed in 1955 to measure residential segregation, and which indicates what proportion of a population would have to change category for two distributions to become identical, reaches 15.7 points between Gabon and the Central African Republic. One inhabitant in six would have to be moved from one age group to another to make these two countries structurally alike.
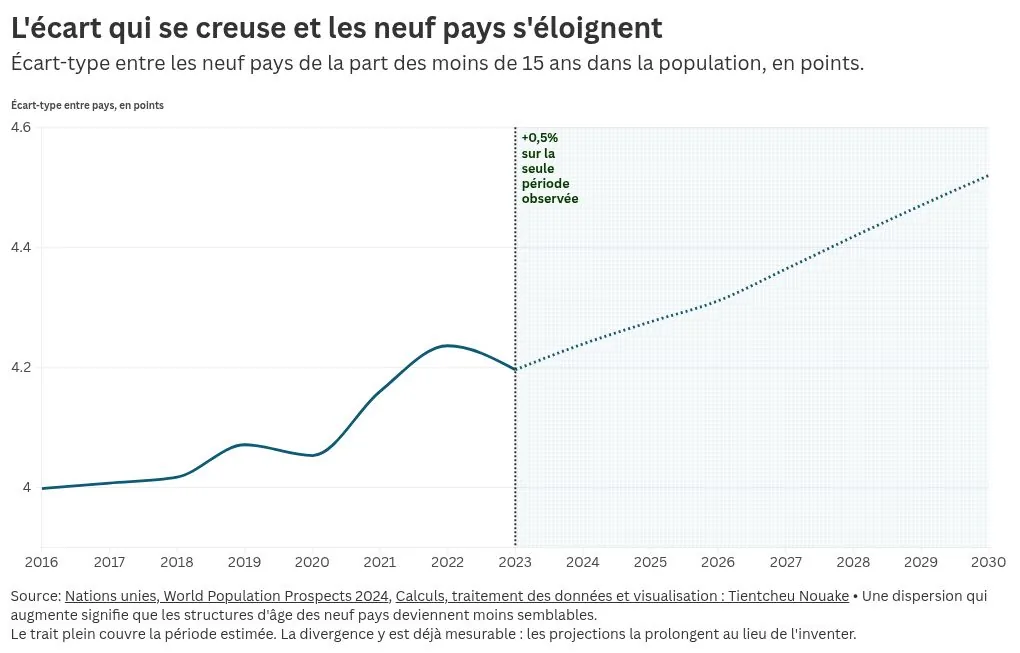
These gaps are widening rather than narrowing. The standard deviation across countries of the share of under-fifteens rises from 3.998 points in 2016 to 4.520 in 2030, an increase of 13.1%. The objection that this movement is merely an artefact of the projections does not hold, since over the estimated period alone, from 2016 to 2023, dispersion already rises by 5.0%.
The problem this poses is less obvious than it appears, and it lies in the use of regional averages. The aggregate profile of Central Africa in 2030 consists of 43.4% under-fifteens, 19.9% fifteen-to-twenty-four-year-olds, 33.6% twenty-five-to-sixty-four-year-olds and 3.1% people aged sixty-five and over. Measured by the same index, each country’s distance from this profile ranges from 0.96 points for Angola to 9.80 for Gabon, by way of 1.62 for the Democratic Republic of the Congo and 1.85 for Chad. Only three countries lie within two points of the average, and they are the ones that together account for nearly three quarters of the regional population. A weighted average takes the shape of its heaviest components, so that this one describes not the region but the Democratic Republic of the Congo, with an Angolan correction. It is the same erasure, on a broader scale, as the one produced by the word Africans when it stands in for a subject.
A Gabonese policymaker who refers to a regional statistic is therefore, without knowing it, referring to the situation of the Democratic Republic of the Congo. The mechanism is that of the dependency ratio on another scale: a measuring instrument that appears neutral carries an implicit assumption, and that assumption systematically penalises atypical cases.
What ought to be measured
Three conclusions seem to me to hold, and I give them in the order in which they commit the reader, from the most technical to the most political.
The first is methodological and is in no way radical. The age dependency ratio would benefit from being published systematically alongside its employment-based version, as nominal gross domestic product and gross domestic product per capita have long been. Neither suffices on its own, the gap between them is informative, and that gap can be calculated from free public series available for almost every country in the world. This is not a statistical undertaking but a convention of presentation.
The second is diagnostic. The positive correlation between a favourable age structure and low employment identifies a type of situation that has no name in the everyday vocabulary of development: that of a country which has made its demographic transition without making its productive transition. Gabon, the Republic of the Congo and Equatorial Guinea fall into this category. Their problem is not to accelerate the fall in fertility, which has largely been achieved, but to build a productive system capable of employing people, something that fifteen years of emergence plans have failed to deliver. Treating them with instruments designed for the Central African Republic or Chad amounts to treating one disease with the remedy for another.
The third concerns the way targets are set. A threshold, that of sixty, structures a large part of the discussion about the continent’s demographic future. It was established on the basis of a regularity observed in economies where working age and employment coincided, which is the case in none of the countries studied here. Nothing obliges us to abandon it, but much argues for no longer treating it as a frontier beyond which some mechanism would be triggered. There is no window opening; there is a constraint slowly loosening, by seven points of burden over six years, which leaves entirely open the question of what will be done with that loosening.
This remark is not scepticism in principle towards indicators, which remain the only means of thinking about aggregates of two hundred and fifty million people. It concerns one particular use: borrowing a figure constructed elsewhere, in a different economic configuration, and treating it as though it carried with it the causal relationship that gave it its original meaning. The dependency ratio does not lie. It answers exactly the question put to it, that of age structure. The trouble begins when it is credited with an answer to another question, that of how many people live off the work of how many others, which it never claimed to answer.
Methodological note
Population data. United Nations, Department of Economic and Social Affairs, Population Division, World Population Prospects, 2024 revision, population files by single year of age and by sex, aggregated into four groups. Values up to 2023 are estimates; those for 2024 to 2030 are medium-variant projections, conditional on the Population Division’s fertility, mortality and migration assumptions. They are not observations.
Scope. The Central Africa sub-region as defined by the United Nations M49 classification: Angola, Cameroon, Republic of the Congo, Gabon, Equatorial Guinea, Central African Republic, Democratic Republic of the Congo, São Tomé and Príncipe, Chad. Six of these nine countries are members of CEMAC, which covers 30.2% of the population of the group so defined, since the Democratic Republic of the Congo is not a member.
Employment rate. International Labour Organization modelled estimates for 2024, republished by the World Bank under indicator SL.EMP.TOTL.SP.ZS, relative to the population aged fifteen and over. São Tomé and Príncipe is excluded from the calculations that use them, as no value has been published.
Economic dependency ratio. Total population minus employed population, divided by employed population, multiplied by one hundred. The employed population is estimated by applying the employment rate to the population aged fifteen and over, which assumes that the rate applies uniformly to the age groups within it and therefore slightly overstates employment among those over sixty-five.
Statistical tests. Pearson and Spearman correlations calculated for the eight countries with both series, 2024 values. Age ratio and employment rate: r = 0.776, p = 0.024; rho = 0.786, p = 0.021. Age ratio and economic ratio: r = −0.400, p = 0.327. Given the size of the sample, these results should be read as orders of magnitude, not as precise estimates.
Index of dissimilarity. Otis Dudley Duncan and Beverly Duncan, “A Methodological Analysis of Segregation Indexes”, American Sociological Review, vol. 20, no. 2, 1955. Half the sum of the absolute differences between the shares of each age group in the two entities compared, expressed in percentage points.
Other references. David E. Bloom and Jeffrey G. Williamson, “Demographic Transitions and Economic Miracles in Emerging Asia”, The World Bank Economic Review, vol. 12, no. 3, 1998, pp. 419–455. Nathan Keyfitz, “On the Momentum of Population Growth”, Demography, vol. 8, no. 1, 1971.